Unlocking Real-Time Video Quality Measurement with x264-pVMAF
In the previous entry of this series, we introduced pVMAF (predictive VMAF)—a lightweight, in-loop video quality metric offering VMAF-level accuracy with minimal computational overhead. Developed initially for Synamedia’s in-house encoders, we’ve now adapted pVMAF for the widely used x264 encoder and made it open-source as x264-pVMAF. This post will guide you through its usage, performance, and future potential.
How to use x264-pVMAF
Our customized x264 encoder (available via this repository) incorporates pVMAF seamlessly as an optional quality metric. Our integration was designed to keep x264’s original functionality intact while adding an advanced, real-time quality measurement tool. Currently, pVMAF supports video quality measurement (VQM) for Full High-Definition (FHD) progressive video encoding with 4:2:0 chroma sampling on x264’s medium preset without “tune” options enabled. By providing VMAF-like quality predictions directly within x264, this setup allows users to monitor and optimize video quality during encoding with minimal setup.
Enabling VQM with x264-pVMAF
To enable pVMAF-based quality measurement during encoding, add the –pvmaf option to your x264 command. For detailed frame-level scores, use this option along with –verbose (or -v) and –log-level debug, which will display pVMAF metrics alongside other enabled metrics. This provides real-time insights into video quality throughout the encoding process. Below is an example command:
./x264 --input-res 1920x1080 --crf 30 --input-csp i420 --fps 30 -o output.264 input.y4m --threads 10 --pvmaf --preset medium --verbose --log-level debug
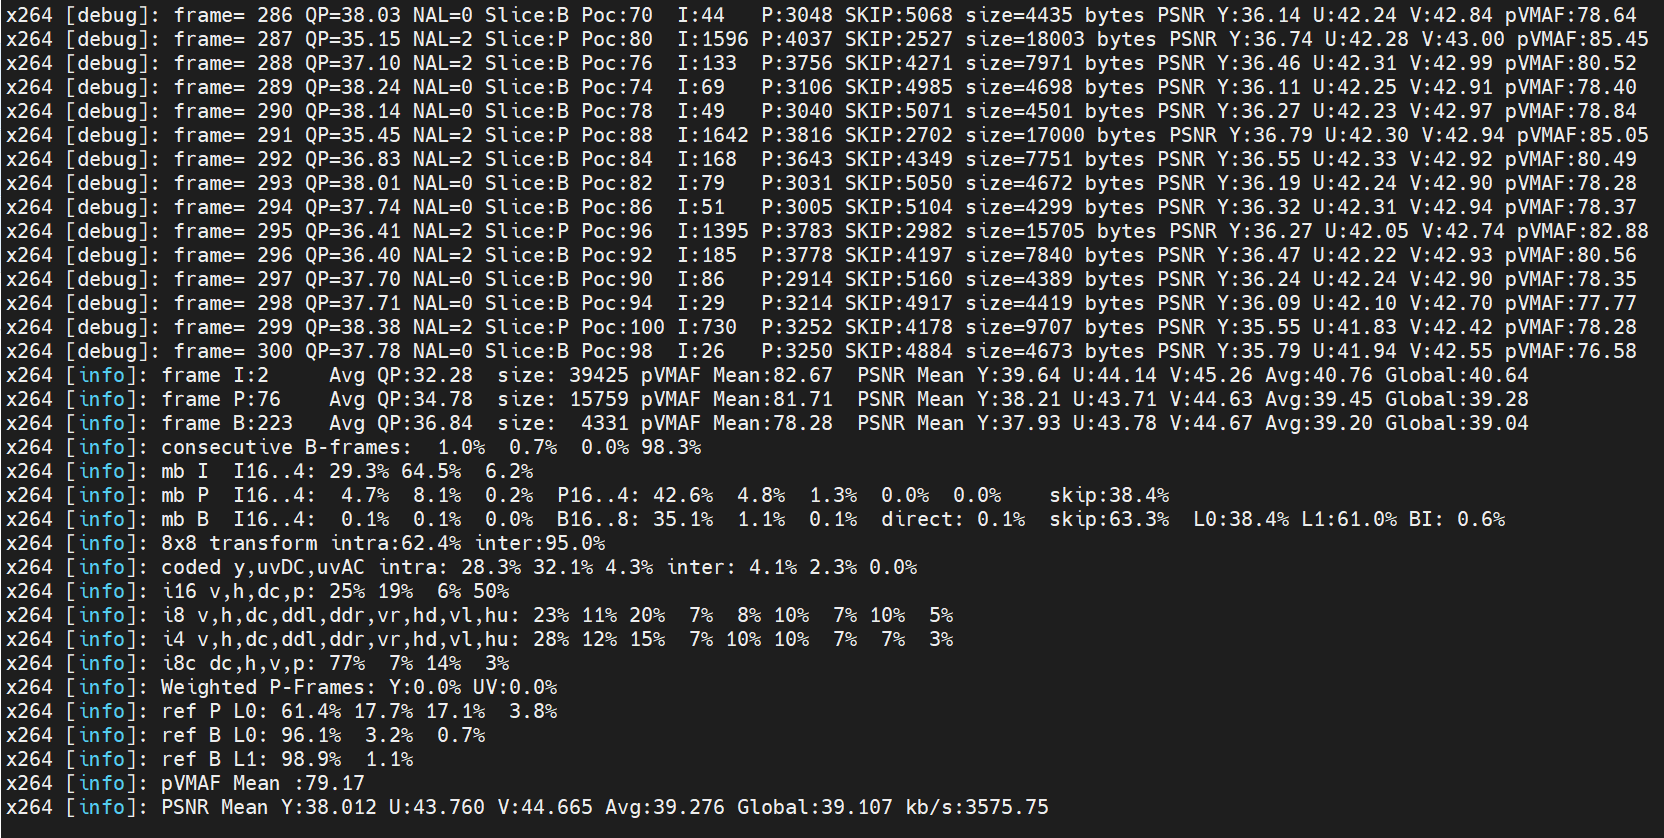
Fig. 1. Encoding with pVMAF enabled, displaying frame-level pVMAF scores during encoding and a quality summary post-encode.
In this example, the pVMAF scores generally fall within the high 70s, which aligns with the expected quality for Quantization Parameter (QP) values in the high 30s. Along with frame-level scores, x264-pVMAF also produces an overall VQM summary at the end of encoding.
Obtain the pVMAF log file
To generate a CSV log file that captures frame-level properties such as display picture number, QP, frame type, and pVMAF score for each frame, add the -l option in combination with –pVMAF. This log file can be particularly useful for detailed post-analysis. Here’s an example command:
./x264 --input-res 1920x1080 --crf 20 --input-csp i420 --fps 30 -l pVMAF_score_log.csv -o output.264 input.y4m --threads 10 --pvmaf --preset medium --verbose --log-level debug
Creating a Comprehensive Feature Log
To output a full log of all features used by pVMAF during quality measurement, use the -g option. This works well in combination with –pvmaf and –psnr, allowing you to capture an extensive feature set for in-depth quality assessment. This detailed feature log is designed to support ongoing research, inviting exploration that may further enhance and optimize pVMAF. Here’s an example command:
./x264 –input-res 1920×1080 –crf 30 –input-csp i420 –fps 30 -g feature_file.csv -o output.264 input.y4m –threads 10 –pvmaf –psnr –preset medium –verbose –log-level debug
x264-pVMAF in Numbers
Prediction Accuracy
x264-pVMAF provides real-time visual quality assessment with VMAF-like accuracy. Trained to emulate the Full High-Definition VMAF model, x264-pVMAF achieves this precision at a significantly reduced computational cost. Table 1 demonstrates the prediction accuracy, tested across a broad and varied dataset. The performance metrics include the Spearman Rank Order Correlation Coefficient (SROCC) and the Pearson Linear Correlation Coefficient (PLCC), which indicate the correlation between x264-pVMAF and VMAF, alongside the Root Mean Squared Error (RMSE) and Mean Absolute Error (MAE), which reflect average prediction error between pVMAF scores and actual VMAF scores. The results show a strong correlation with VMAF and minimal prediction errors, underscoring the precision of pVMAF as a reliable, low-cost alternative for visual quality measurement.
| Performance metric | Frame-level | Sequence-level |
|---|---|---|
| SROCC | 0.991 | 0.996 |
| PLCC | 0.993 | 0.997 |
| RMSE | 3.7 | 2.48 |
| MAE | 2.51 | 1.65 |
Table 1: Performance metrics for x264-pVMAF replicating VMAF, with evaluations conducted at both the frame and sequence levels across a large-scale test dataset.
The scatter plot in Figure 2 further illustrates x264-pVMAF’s ability to mirror VMAF accurately across a wide quality spectrum. Each dot represents a unique distorted video, with VMAF scores on the X-axis and pVMAF scores on the Y-axis, color coded by source.
Fig. 2. Scatter plot comparing pVMAF and VMAF predictions on the LIVE NFLX PLUS test fold.
Computational Efficiency
Leveraging efficient feature extraction, x264-pVMAF integrates encoder parameters and lightweight pixel-based features, including PSNR on the luma component, to maintain computational efficiency. While less efficient than Synamedia’s in-house pVMAF models due to x264’s lack of pre-analysis statistics, x264-pVMAF can still be deployed in real time. Table 2 shows CPU impact per FHD frame at medium preset, compared to other metrics available in x264:
| VQ Metric | Increase in CPU time per FHD frame (ms) | Increase in CPU cycles per FHD frame (%) |
|---|---|---|
| PSNR-Y | 0.54 | 0.43 |
| SSIM | 0.98 | 1.55 |
| pVMAF | 3.17 | 3.93 |
Table 2: CPU overhead for VQM metrics in x264, measured on the medium preset.
For broader comparison, Table 3 highlights runtime per FHD frame of various metrics available in FFmpeg, including our reference metric VMAF, underscoring pVMAF’s strong efficiency in comparison:
| Metric | Runtime per FHD frame (ms) |
|---|---|
| PSNR | 0.77 |
| PSNR-HVS | 63.8 |
| SSIM | 31.19 |
| MS-SSIM | 528.39 |
| VMAF | 112.84 |
| pVMAF | 3.17 |
Table 3: Runtime analysis of VQM metrics available in FFmpeg, in comparison to pVMAF.
 Fig. 3. Accuracy versus runtime trade-off across metrics, with accuracy measured by frame-level SROCC correlation to VMAF.
The efficiency of x264-pVMAF, illustrated in Figure 3 as a scatter plot of runtime (on a logarithmic scale) versus prediction accuracy, shows how the metric offers an optimal trade-off: it’s over 35 times faster than VMAF, yet provides quality predictions with a VMAF-level accuracy. Though not the absolute fastest metric, x264-pVMAF occupies a unique position by balancing speed with perceptual accuracy, making it ideal for live workflows that need accurate, real-time video quality monitoring.
Quality Tracking: Moving Beyond PSNR
Fig. 4. Frame-level quality scores for VMAF, pVMAF, and PSNR-Y on a video encoded with x264, showing fluctuations in perceived quality across frames.
While metrics like PSNR are frequently used for real-time monitoring and rate control, they don’t fully capture viewer-perceived quality. As illustrated in Figure 4, where we compare frame-level PSNR, VMAF, and pVMAF scores for a distorted video (CrossWalk scene, 2048×1080, CRF 35), VMAF detects frequent quality fluctuations, which PSNR misses. pVMAF, however, closely follows VMAF’s frame-level predictions, detecting subtle quality changes. This responsiveness could make pVMAF invaluable in rate control, enabling it to steer encoding quality more effectively.
Future Directions: What’s Next for pVMAF
The launch of x264-pVMAF marks just the beginning of Synamedia’s commitment to advancing real-time VQM and live video encoding. We’re already exploring the next phases of pVMAF, with plans to expand its availability to newer codecs, broaden its compatibility with diverse encoding parameters, and push for even higher precision and efficiency. Stay tuned—exciting developments are on the horizon!
About the Authors
Sangar Sivashanmugam:
Sangar received his B.E. degree in instrumentation and control engineering from P.S.G. College of Technology, Coimbatore, India, in 2016, and the M.E. degree in electrical and computer engineering, specializing in artificial intelligence and machine learning, from the University of Waterloo, Canada, in 2021.
Since 2022, he has been a Senior Video Algorithm Engineer in the Research & Development division at Synamedia, where he works within the Video Codec team. He is actively involved in the development of Synamedia’s in-house VVC codec. He applies his expertise in artificial intelligence and machine learning algorithms to optimize codec performance and develop new video quality assessment algorithms. His research interests include video compression technologies, as well as the application of artificial intelligence in computer vision and natural language processing.
Axel De Decker:
Axel De Decker is a doctoral researcher at Synamedia’s Research and Development division, pursuing an industry Ph.D. in collaboration with Ghent University. His work focuses on video quality assessment and video compression.
Jan De Cock:
Jan leads the compression team at Synamedia and is responsible for the company’s codec development operations. Having spent his entire career in the compression space, most recently as Manager of Video and Image Encoding at Netflix, Jan is one of the industry’s foremost encoding experts.
Prior to his role at Netflix, Jan was Assistant Professor in the Department of Electronics and Information Systems at Ghent University in Belgium.
Jan holds a PhD in Engineering from Ghent University in Belgium. He was general co-chair of the 2018 Picture Coding Symposium (PCS), co-organizer of the 1st AOMedia Research Symposium in 2019, and has been a presenter and speaker at a wide range of international conferences.


